
A Beginner’s Guide to ApexGuru, Code Analyser, and DevOps Centre
In 2025, enterprises demand faster releases, better performance, and airtight compliance, all while managing increasingly complex orgs.
To meet these expectations, Salesforce has introduced a modern toolchain purpose-built for the platform’s unique development model:
- ApexGuru: an AI-driven assistant for Apex code optimization
- Salesforce Code Analyzer: a robust static code analysis engine
- Salesforce DevOps Center: a visual, source-driven release management system
Together, these tools are reshaping how developers and architects build, review, and deploy applications on Salesforce — merging DevOps best practices with the power of AI and automation.
What Is ApexGuru?
ApexGuru is Salesforce’s AI assistant designed to identify and help resolve Apex performance issues automatically. Integrated into Scale Center, it uses runtime profiling and Salesforce’s own CodeGen AI models to detect critical anti-patterns and performance bottlenecks based on actual org telemetry.
What makes ApexGuru transformative isn’t just detection — it’s prescriptive, organization-specific fixes that help developers optimize code in real-time, avoiding governor limits and improving response times without trial and error.
How It Works
Once enabled, ApexGuru scans your Apex classes weekly across four key dimensions:
Code Recommendations
It flags inefficient patterns — such as SOQL inside loops — with severity levels (Critical, Major, Minor) and displays a side-by-side comparison of “code before” and “recommended code.”
SOQL & DML Analysis
ApexGuru detects inefficient database interactions (e.g., unselective queries or excessive DML calls), and suggests indexing strategies, bulkification, and optimized patterns.
Expensive Methods
It identifies methods consuming the most CPU time, based on the last 15 days of production telemetry. Anything using over 5% of a transaction’s CPU time is flagged as critical.
Unused Classes and Methods
Dead code that hasn’t been invoked in two weeks? ApexGuru identifies and recommends cleanup, helping reduce bloat and technical debt.
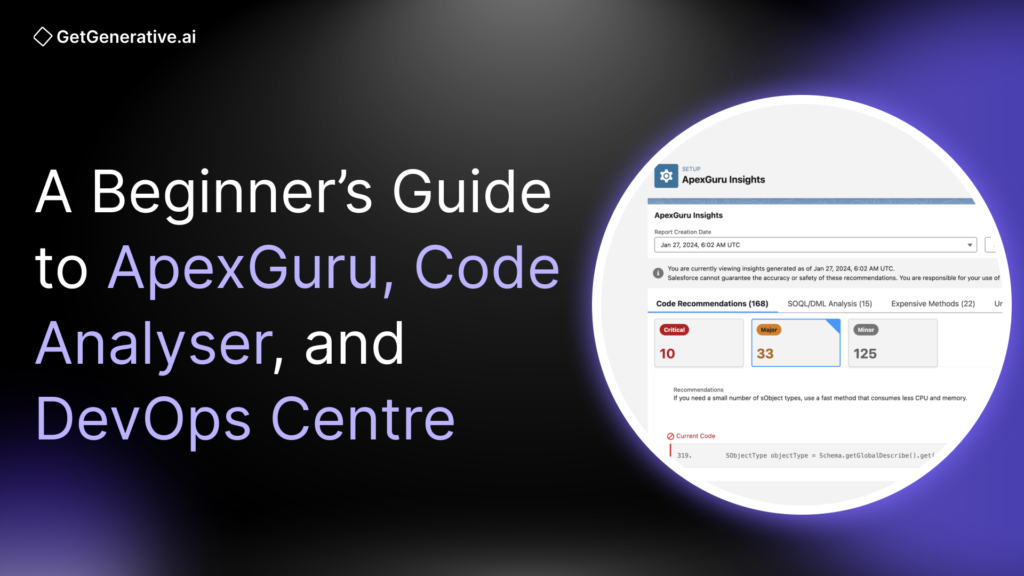
The Setup & Dashboard
Setup is seamless:
- Go to Setup > Scale Center > ApexGuru Insights
- Accept terms; ApexGuru starts scanning automatically
- Results populate in a dedicated dashboard, categorized by severity
A typical dashboard might show:
- 10 critical, 37 major, and 248 minor recommendations
- Each flagged issue includes org-specific context and a smart fix suggestion
Real-World Benefits and ROI
✅ Performance Gains
Early adopters experienced a 70% reduction in CPU time for critical processes.
For example, two high-load transactions experienced a 60% and 45% reduction in CPU usage after implementing ApexGuru’s fixes.
✅ Reduced Technical Debt
Unused classes and anti-patterns are systematically flagged, helping clean up legacy code and prevent future incidents.
✅ Continuous Learning
By showing best practices (e.g., bulkified queries, selective filtering), ApexGuru helps developers write better Apex, not just fix what’s broken.
✅ Cost Efficiency
It’s free for Unlimited Edition, Full Copy Sandboxes, Signature, and Scale customers, making it a no-brainer for enterprise teams.
Salesforce Code Analyzer
Where ApexGuru provides runtime insights, Salesforce Code Analyzer (SFCA) focuses on static code analysis — scanning Apex, LWC, Aura, and Visualforce components to catch security, performance, and style issues before code is ever deployed.
This tool integrates leading engines like:
- PMD (Apex, Java rule enforcement)
- ESLint (for JavaScript and LWC)
- RetireJS (vulnerable JS libraries)
- Regex engine (for custom patterns)
- Graph Engine (for Apex data flow — in dev preview)
With 500+ rules out of the box, Code Analyzer acts as a static gatekeeper for quality and security across the entire SDLC.
Key Use Cases and Features
Real-Time Feedback via VS Code
With the Salesforce Extensions Pack for VS Code, developers get linting and suggestions instantly as they type. The extension even surfaces ApexGuru insights (in pilot) inside the IDE.
CI/CD Integration
Via Salesforce CLI, Code Analyzer scans can be run in GitHub Actions, Jenkins, or any other CI system. This enables quality gates that fail builds if critical issues are found.
GitHub + DevOps Center Integration
DevOps Center integrates Code Analyzer into the DevOps Testing Framework, automating scans at each release stage with enforcement via quality gates.
Custom Reporting
Output formats include JSON, HTML, CSV, with HTML providing severity breakdowns, rule violations, and developer-friendly filtering.
Also Read – The ROI of AI-Powered Development in Salesforce Projects
Code Analyzer v5: What’s New in 2025
Unified Rule Management
Configure all engines and severities in a single code-analyzer.yml file.
Salesforce Graph Engine
Deep data-flow analysis uncovers issues like SOQL injection or insecure CRUD/FLS patterns — even across method chains.
Flow Scanner Engine
Static analysis now extends to Salesforce Flows, catching misconfigurations, loops, or security vulnerabilities in declarative logic.
Lighter & Faster IDE Extension
Code Analyzer’s VS Code plugin is now 90% smaller and loads 90% faster, enhancing the developer experience.
AI-Powered Fixes
Salesforce is piloting AI-assisted quick fixes that comment recommended code blocks directly into your files — a major leap toward autonomous remediation.
Best Practices for Using Code Analyzer
- Treat Static Analysis as a First-Class Citizen
Incorporate Code Analyzer scans into every commit, pull request, and deployment step. - Customize Rules by Org Sensitivity
Not every org cares equally about style vs. performance vs. security. Tailor severity levels to reflect business priorities. - Automate Quality Gates
Use DevOps Testing or CI pipelines to enforce zero tolerance for high-severity issues. - Track Trends Over Time
Utilize HTML reports and DevOps Center history to track the reduction in issue counts across sprints. Celebrate clean scans. - Train Teams on Common Violations
Recurring issues (e.g., missing FLS checks) signal areas for upskilling. Turn static analysis into a teaching moment.
What Is Salesforce DevOps Center?
Salesforce DevOps Center is a free, Salesforce-native release management tool that replaces traditional change sets with a modern, Git-based DevOps workflow. It enables source control, CI/CD automation, and unified collaboration across developers, admins, and release managers.
With over 250,000+ Salesforce customers still relying on manual deployments, DevOps Center represents a monumental shift toward scalable, error-free releases for teams of all sizes.
Core Capabilities of DevOps Center
Work Items and Metadata Tracking
Each Work Item represents a feature, task, or bug fix. DevOps Center tracks metadata changes (custom objects, fields, Apex classes, Flows, etc.) against each Work Item automatically — no more spreadsheets or forgotten components.
Git-Based Version Control
The DevOps Center commits all changes to GitHub in real-time, abstracting Git commands for less technical users. This provides:
- Full version history
- Rollbacks
- Branch merging
- Change auditing
Note: GitHub is the only VCS supported natively today. Bitbucket or Azure DevOps users must migrate or wait for broader VCS support.
Visual Pipeline with Stage Promotion
Work Items move through a pipeline, progressing from Dev → QA → UAT → Prod, and each stage corresponds to a connected organization. Promotion is one click, with auto-deployments and Git merges behind the scenes.
Collaboration Across Roles
Admins, developers, and testers all use the same interface. Whether a Flow is built via clicks or Apex via code, DevOps Center treats both as tracked changes in the same Work Item and pipeline.
Also Read – How Small Teams Can Deliver Enterprise-Level Salesforce Projects with AI
Key Concepts & Terminology
Term | Description |
Project | A logical unit in DevOps Center tied to a GitHub repo and org pipeline |
Work Item | Represents a story/bug/task with associated metadata changes |
Environment | A connected Salesforce org (Dev, QA, UAT, Prod) |
Pipeline | The visual sequence of stages your Work Items move through |
Quality Gates | Rules that must pass (tests, static analysis) before promotion |
DevOps Testing Framework
Launched in 2025, Salesforce DevOps Testing enhances the DevOps Center by adding automated test suites and quality gates for Work Items.
Supported Test Types:
- Salesforce Code Analyzer
- Apex Unit Tests
- External UI tests (e.g., Selenium, Provar)
- Custom scripts via test provider integrations
Key Capabilities:
- Define test suites at each pipeline stage
- Set pass/fail criteria (e.g., “No critical Code Analyzer issues allowed”)
- Automatically block promotion if a gate fails
- View test histories and violation details inline with each Work Item
Example: At the UAT stage, a test suite might require:
✅ 100% Apex test pass rate
✅ ≥ 75% code coverage
✅ No critical static analysis violations
✅ 0 high-severity security risks
Final Thoughts
These tools are free, natively integrated, and already powering the next wave of Salesforce innovation. By leveraging AI-assisted performance insights, automated code governance, and modern release pipelines, you gain a strategic edge, enabling your team to deliver at scale, securely, and with confidence.

At GetGenerative.ai, we’ve reinvented Salesforce implementation from the ground up—with AI woven into every layer. This isn’t traditional delivery with a touch of AI. It’s a truly AI-native model that delivers faster, smarter results through our proprietary platform.
👉 Explore our AI Salesforce consulting services